Saturday, June 16, 2012

Are Campaign Slogans Getting Shorter?

In 2008, Americans elected a president whose slogan was the shortest ever, both in terms of syllables and length:  "Hope."  I wonder:  have US presidential campaign slogans gotten shorter?  Perhaps a low level of public interest in American politics and decreasing attention spans together have led to the public favoring the candidate with the shortest slogan.

In US history class I learned about the revolutionary "I Like Ike" campaign ad.  Television was a relatively new medium in the 1950s and was just beginning to see widespread adoption, and the commercial featured a catchy tune that stuck in your head, a short slogan, and visuals that subtly reminded you of Eisenhower's credentials.  Maybe each advance in media has further decreased Americans' attention span, and as such slogans have kept getting shorter each year until we hit the information limit of one syllable and four letters in 2008.  To address my question, I pulled a list of 200 US presidential campaign slogans from tagline guru, removed all of the "anti-" slogans, and then for each remaining entry marked whether or not that campaign was successful and how many syllables were in the slogan.  If slogans have indeed gotten shorter, then I should see a negative trend in their length over time.


Figure 1:  Syllable (left) and Character (right) length of US presidential campaign slogans.  Winning campaign slogans are in green, losing in red.  If multiple slogans were used by the same candidate in the same campaign, then all are included.  

Figure 1 shows scatter-plots of syllable and character length of US presidential campaign slogans versus year.  I have not included trend lines, because the scatter is obviously so great that the result wouldn't be particularly meaningful.  The length of successful or unsuccessful presidential campaign slogans does not appear to have changed much across the last two centuries of US history.


Figure 2:  Histograms of  syllable (left) and character (right) length of US presidential campaign slogans.  Green represents winning slogans, red represents losing slogans.


In figure 2, I have produced a chart of the relative frequency of each slogan length hoping to find some evidence that Americans have historically had some preference of shorter versus longer slogans.  In fact, a t-test indicates that the average winning slogan has on average 7.35 syllables and the losing slogans have on average 6.51 syllables, with p=0.05 (this means that the probability that the means of these distributions are actually the same, and this result occurred from random chance alone, is 0.05, or 1 in 20).  On the other hand, the average winning slogan has 25.7 characters and the average losing slogan has 23.6 characters, with p=0.15.  The large p-values and the similar means indicate that there is probably no preference between longer and shorter slogans.  If there is a preference, however, it is in favor of longer slogans!

So, US presidential campaign slogans have on average remained the same length throughout American history, and there is weak evidence (p=0.05) that Americans prefer syllabically longer campaign slogans to shorter ones.


Tuesday, June 5, 2012

The Cob-Web

While doing some web scraping for another project, I collected some ancillary data that I think you'll find interesting.  I wrote a program to  collect a comprehensive list of .com top level domains, and I wondered:  how many .com domains are there?  How long is the average domain?  The longest?  Roughly what proportion of them are parked, typical websites, or pornography?

The answer, I thought, was actually pretty sad.  The web that I had been led to believe was predominantly pornography and parking was actually mostly abandoned.  In my simple random sample, there were more parked domains than all other non-404 websites combined.  I'll get to that in a bit.  Please note that this study only concerns .com domains, not .net, .org, .gov, .edu, or anything else.


Let's start by taking a look at the distribution of domain name lengths.  Since my data file included the ".com" part, but not the "http://" part, I could parse out the domain name proper with a simple one-liner in bash:

awk '{print length($1)-4}' domainList | sort -n | uniq -c | awk '{print $2, $1}'
Figure 1:  Two views of the number of registered .com domains versus the length of the domain name.  Note the logarithmic scale on the left.  

Remarkably, there were only three registered one-letter domain names:  q.com, x.com and z.com (these must be grandfathered in), and z.com returned a 404 error.  There were available and unregistered 2-letter domain names, and there were at least a million domains having each length from 5-21.  The most common domain name length was 11, and there were 547 .com domains with the maximum length of 63 characters.  I counted 54,816,663 registered dot-com domains total on April 30, 2012.

Now I wanted to get a handle on what the landscape of the web looked like.  I used another simple one-liner to generate a list of 100 randomly selected domains from my collection:

awk '{print rand(), $1}' domainList | sort -n -k 1 | head -n 100 | awk '{print $2}'

I acted as my own Mechanical Turk, classifying each of the 100 domains in my simple random sample as either 404, parked, XXX, website placeholder, or website.  Website placeholders were purchased, but never developed and displayed a message from the registrar.  A 95% confidence interval is given for each type.


Type of .comProportion (95% CI)
40448 ± 9.8%
Parked28 ± 8.8%
'Normal' Website19 ± 7.7%
Placeholder4 ± 3.8%
'XXX' Website1 ± 1.9%
Table 1:  Types of website, and proportion in my n=100 random sample.


Table 1 gives a surprising view of our web:  about half of it returns a 404 error.  About a quarter of it is parked by people seeking to make an easy buck by re-selling the domain.  About a fifth is what we would consider a website, and the remainder is either a placeholder where someone will ostensibly develop a new website or pornography, which is actually apparently quite rare compared to typical personal or corporate web pages.

Though the error bars are quite large (admittedly, I tired of being a Mechanical Turk), this exercise challenged my stereotype of the web.  This shows that there is a huge amount of turnover where domains are relinquished and picked up, mostly by domain parking speculators but also by legitimate people and businesses.    It also raises another concern:  if a website can be considered part of the culture of the information age, what is happening to the enormous amount of information and data that is being turned over?  The internet archive has put forth a valiant effort, but nonetheless websites disappear like the great cities of the past, except without any ruins that future historians could ever hope to dig up and analyze.

It may prove that the information age has a very short memory!


Monday, June 4, 2012

How Fast is My Internet Connection, Actually?

A series of tubes.
When diagnosing the speed of my internet connection, I'd been using online speed tests such as speedtest.net to determine what sort of bandwidth I was getting.  I lamented, however, that these were single data points and as such were not sufficient to say one way or the other whether or not my ISP was actually network-neutral or whether I was getting this speed at all times.  Further, since cable internet is a shared line, I'd like to know what the fluctuation in bandwidth over a day looks like.

I found the open-source suite NeuBot, which uses a distributed network of speed test servers as well as BitTorrent peers to periodically test my connection speed and determine what my bandwidth is over time, which is certainly a much better measure than the single data points offered by most simple online bandwidth tests.

First, some details about my setup:
  • I have the Comcast/Xfinity Blast plan, which offers 20Mbps down and 4Mbps up, and actually a bit faster considering the "PowerBoost" feature which provides 20% more speed for the first 20MB of a file down, and 10MB up.
  • I am using an Arris TouchStone WBM760A and a Linksys WRT54GL router.
  • When testing the wireless connection, I put my desktop wireless antenna next to the router.
  • I did not in any way control for what else I may have been doing on the network at the time.
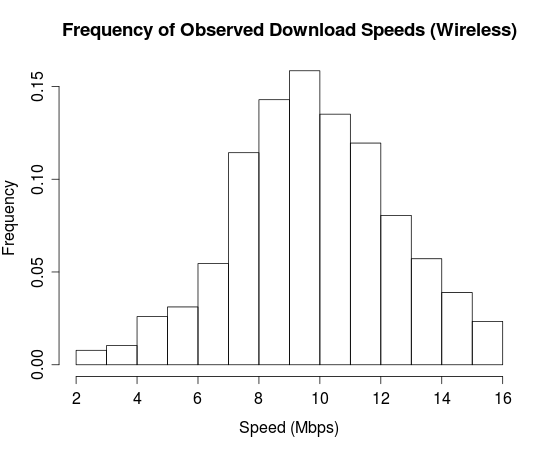
Since my router claims to support speeds up to 54Mbps, let me now compare my connection speeds while on wireless to those on the wired connection.  I copy and pasted the data out of Neubot, and ran the following lines of R:

data <- read.table("~/Desktop/speedtest-wired.dat")

hist(data[,10], freq=FALSE, main="Frequency of Observed Download Speeds (Wired)", xlab="Speed (Mbps)", ylab = "Frequency")
hist(data[,12], freq=FALSE, main="Frequency of Observed Upload Speeds (Wired)", xlab="Speed (Mbps)", ylab = "Frequency")

Figure 1:  Upload and Download speeds on Wired and Wireless connection with the Linksys WRT54GL.

Intriguingly, my "54 Mbps" Linksys router is not able to provide nearly the promised download speed on the wireless.  On wireless, it provided an average of 9Mbps down and reasonable performance up, whereas on the wired connection my connection speeds were just as promised down, and perhaps a bit slow at about 3.5 Mbps up.  Since the download speeds on the wireless look Gaussian, I am led to believe that this is due to interference from local sources such as other wireless networks.

Now let's see if I can detect throttling of BitTorrent.  Neubot tests both BitTorrent as well as a conventional speed test, and so if the connection is net-neutral, I expect to see very similar speeds both down and up.

Figure 2:  Upload and Download speeds for normal speed tests versus BitTorrent upload and download speeds.  

While the upload and download speeds for BitTorrent appeared quite a bit more noisy than those for the normal speed test, the results are quite similar with the most noticeable difference being the long tail of slower upload speeds for BitTorrent.  It would require data from considerably more computers to make a case for this being throttling of BitTorrent connections, and so I have contributed my data to the collection being amassed by the NeuBot project.  

Now let's look at how my connection speed varies throughout the day.  Since cable internet connections are on a shared line, I should see my connection speed reduced during peak times of use.  I used the following R to generate these plots:

require(gplots)
require(foreach)

errbars <- function(x, y) {
  mygroups <- unique(x)

  groups <- foreach(i = 1:length(mygroups)) %do% {return(y[x==x[i]])}
  

  yavg <- unlist(lapply(groups, mean))
  ystdv <- unlist(lapply(groups, sd))

  return(list(x=mygroups, lo=yavg-ystdv, yavg=yavg, hi=yavg+ystdv))
}

bars <- errbars(as.numeric(regmatches(as.character(data[,2]), regexpr("[[:digit:]]+", as.character(data[,2])))), data[,10])
plotCI(bars$x, bars$yavg, ui=bars$hi, li=bars$lo, xlab="Hour of Day", ylab="Observed Download Speed (Mbps)")

Figure 3:  Variation in wired connection speeds throughout the day.  Error bars are one standard deviation. 

Connection speeds appeared to be remarkably stable throughout the day, and clearly more data would be necessary in order to see any significant difference between the speeds at various times.  This data was collected over two weeks, and there were about 20 data points per hour.  Suffice it to say that if there is variation in my connection speed throughout the day, it is not very large, no more than 2Mbps down and perhaps 250Kbps up.

This exercise tested my internet connection speed systematically, and I found nothing lacking in Comcast/Xfinity's service.  In particular, I learned the following about my connection:
  • Despite the label saying that my Linksys WRT54GL router supports 54Mbps connection speeds, it is unable to deliver even 20Mbps over wireless.  The Gaussian connection speed profile in figure 1 leads me to believe that there is some interference confusing it.  
  • The median connection speeds for the normal speed test and BitTorrent test are both nearly the same as my advertised connection speed, indicating that Comcast/Xfinity is not throttling BitTorrent in any noticeable fashion.
  • My internet connection speed did not change significantly throughout the day, which is surprising given that I am on a line shared with everyone in my building and perhaps some neighboring buildings.  Perhaps this accusation which is leveled at cable internet providers by fiber and DSL providers is unfair.
I encourage you to install NeuBot yourself and put your own ISP to the test!

Thanks to L D Christoph for allowing me to use her connection as a control group.