 |
| A series of tubes. |
First, some details about my setup:
- I have the Comcast/Xfinity Blast plan, which offers 20Mbps down and 4Mbps up, and actually a bit faster considering the "PowerBoost" feature which provides 20% more speed for the first 20MB of a file down, and 10MB up.
- I am using an Arris TouchStone WBM760A and a Linksys WRT54GL router.
- When testing the wireless connection, I put my desktop wireless antenna next to the router.
- I did not in any way control for what else I may have been doing on the network at the time.
data <- read.table("~/Desktop/speedtest-wired.dat")


hist(data[,10], freq=FALSE, main="Frequency of Observed Download Speeds (Wired)", xlab="Speed (Mbps)", ylab = "Frequency")

hist(data[,12], freq=FALSE, main="Frequency of Observed Upload Speeds (Wired)", xlab="Speed (Mbps)", ylab = "Frequency")
| 
|

| 
|
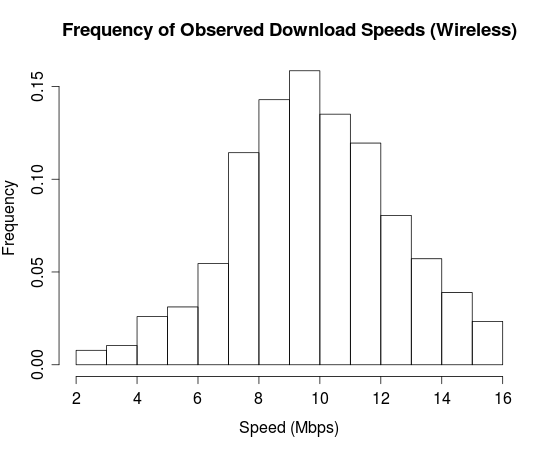
Figure 1: Upload and Download speeds on Wired and Wireless connection with the Linksys WRT54GL.
Intriguingly, my "54 Mbps" Linksys router is not able to provide nearly the promised download speed on the wireless. On wireless, it provided an average of 9Mbps down and reasonable performance up, whereas on the wired connection my connection speeds were just as promised down, and perhaps a bit slow at about 3.5 Mbps up. Since the download speeds on the wireless look Gaussian, I am led to believe that this is due to interference from local sources such as other wireless networks.
|
|

| 
|
Figure 2: Upload and Download speeds for normal speed tests versus BitTorrent upload and download speeds.
While the upload and download speeds for BitTorrent appeared quite a bit more noisy than those for the normal speed test, the results are quite similar with the most noticeable difference being the long tail of slower upload speeds for BitTorrent. It would require data from considerably more computers to make a case for this being throttling of BitTorrent connections, and so I have contributed my data to the collection being amassed by the NeuBot project.
Now let's look at how my connection speed varies throughout the day. Since cable internet connections are on a shared line, I should see my connection speed reduced during peak times of use. I used the following R to generate these plots:
require(gplots)

require(foreach)


errbars <- function(x, y) {

  mygroups <- unique(x)


  groups <- foreach(i = 1:length(mygroups)) %do% {return(y[x==x[i]])}
  yavg <- unlist(lapply(groups, mean))

  ystdv <- unlist(lapply(groups, sd))


  return(list(x=mygroups, lo=yavg-ystdv, yavg=yavg, hi=yavg+ystdv))

}


bars <- errbars(as.numeric(regmatches(as.character(data[,2]), regexpr("[[:digit:]]+", as.character(data[,2])))), data[,10])

plotCI(bars$x, bars$yavg, ui=bars$hi, li=bars$lo, xlab="Hour of Day", ylab="Observed Download Speed (Mbps)")

| 
|
Figure 3: Variation in wired connection speeds throughout the day. Error bars are one standard deviation.
This exercise tested my internet connection speed systematically, and I found nothing lacking in Comcast/Xfinity's service. In particular, I learned the following about my connection:
- Despite the label saying that my Linksys WRT54GL router supports 54Mbps connection speeds, it is unable to deliver even 20Mbps over wireless. The Gaussian connection speed profile in figure 1 leads me to believe that there is some interference confusing it.
- The median connection speeds for the normal speed test and BitTorrent test are both nearly the same as my advertised connection speed, indicating that Comcast/Xfinity is not throttling BitTorrent in any noticeable fashion.
- My internet connection speed did not change significantly throughout the day, which is surprising given that I am on a line shared with everyone in my building and perhaps some neighboring buildings. Perhaps this accusation which is leveled at cable internet providers by fiber and DSL providers is unfair.
Thanks to L D Christoph for allowing me to use her connection as a control group.
Hey Ben,
ReplyDeleteI'm trying to run your experiment on my own connection because it's been pretty flakey the last few days.
How did you get the data out of Neubot into that .dat file?
-Greg
It's been a while since I've run this experiment, but I seem to recall that NeuBot had a pane that let me view the history of tests and I just cut and pasted the data out of that and into a text editor. If that doesn't work for you, I will check for a script that did it when I'm back at that computer.
Delete